


Debugging Java Equals and Hashcode Performance in Production
Hashcode and equals are at the crux of many hard to nail down Java performance issues. Here's how to track it in production.


Table of contents
I wrote a lot about the performance metrics of the equals method and hash code in this article. There are many nuances that can lead to performance problems in those methods. The problem is that some of those things can be well hidden.
To summarize the core problem: the hashcode method is central to the java collection API. Specifically, with the performance of hash tables (specifically the Map interface hash table). The same is true with the equals method. If we have anything more complex than a string object or a primitive, the overhead can quickly grow.
But the main problem is nuanced behavior. The example given in the article is that of the Java SE URL class. The API for that class specifies that the following comparison of these distinct objects would evaluate to true:
new URL("http://127.0.0.1/").equals(new URL("http://localhost/"));

new URL("http://127.0.0.1/").hashcode() == new URL("http://localhost/").hashcode();
This is a bug in the specification. Notice this applies to all domains, so lookup is necessary to perform hashing or equals. That can be very expensive.
TIP: performance of equals/hashcode must be very efficient for usage in key values containers such as maps and other hash-based collections
There are so many pitfalls with these methods. Some of them would only be obvious at scale. E.g. a friend showed me a method that compared objects and had an external dependency on a list of potential values. This performed great locally but slowly in production where the list had more elements.
How can you tell if a hash function is slow in production?
How do you even find out that it’s the fault of the hash function?
Measuring Performance
For most intents and purposes, we wouldn’t know the problem is in the equals method or hash code. We would need to narrow the problem down. It’s likely that a server process would take longer than we would expect and possibly show up on the APM.
What we would see on the APM is the slow performance of a web service. We can narrow that down by using the metrics tools provided by Lightrun.
Note: Before we proceed, I assume you’re familiar with the basics of Lightrun and have it installed. If not, please check out this introduction.
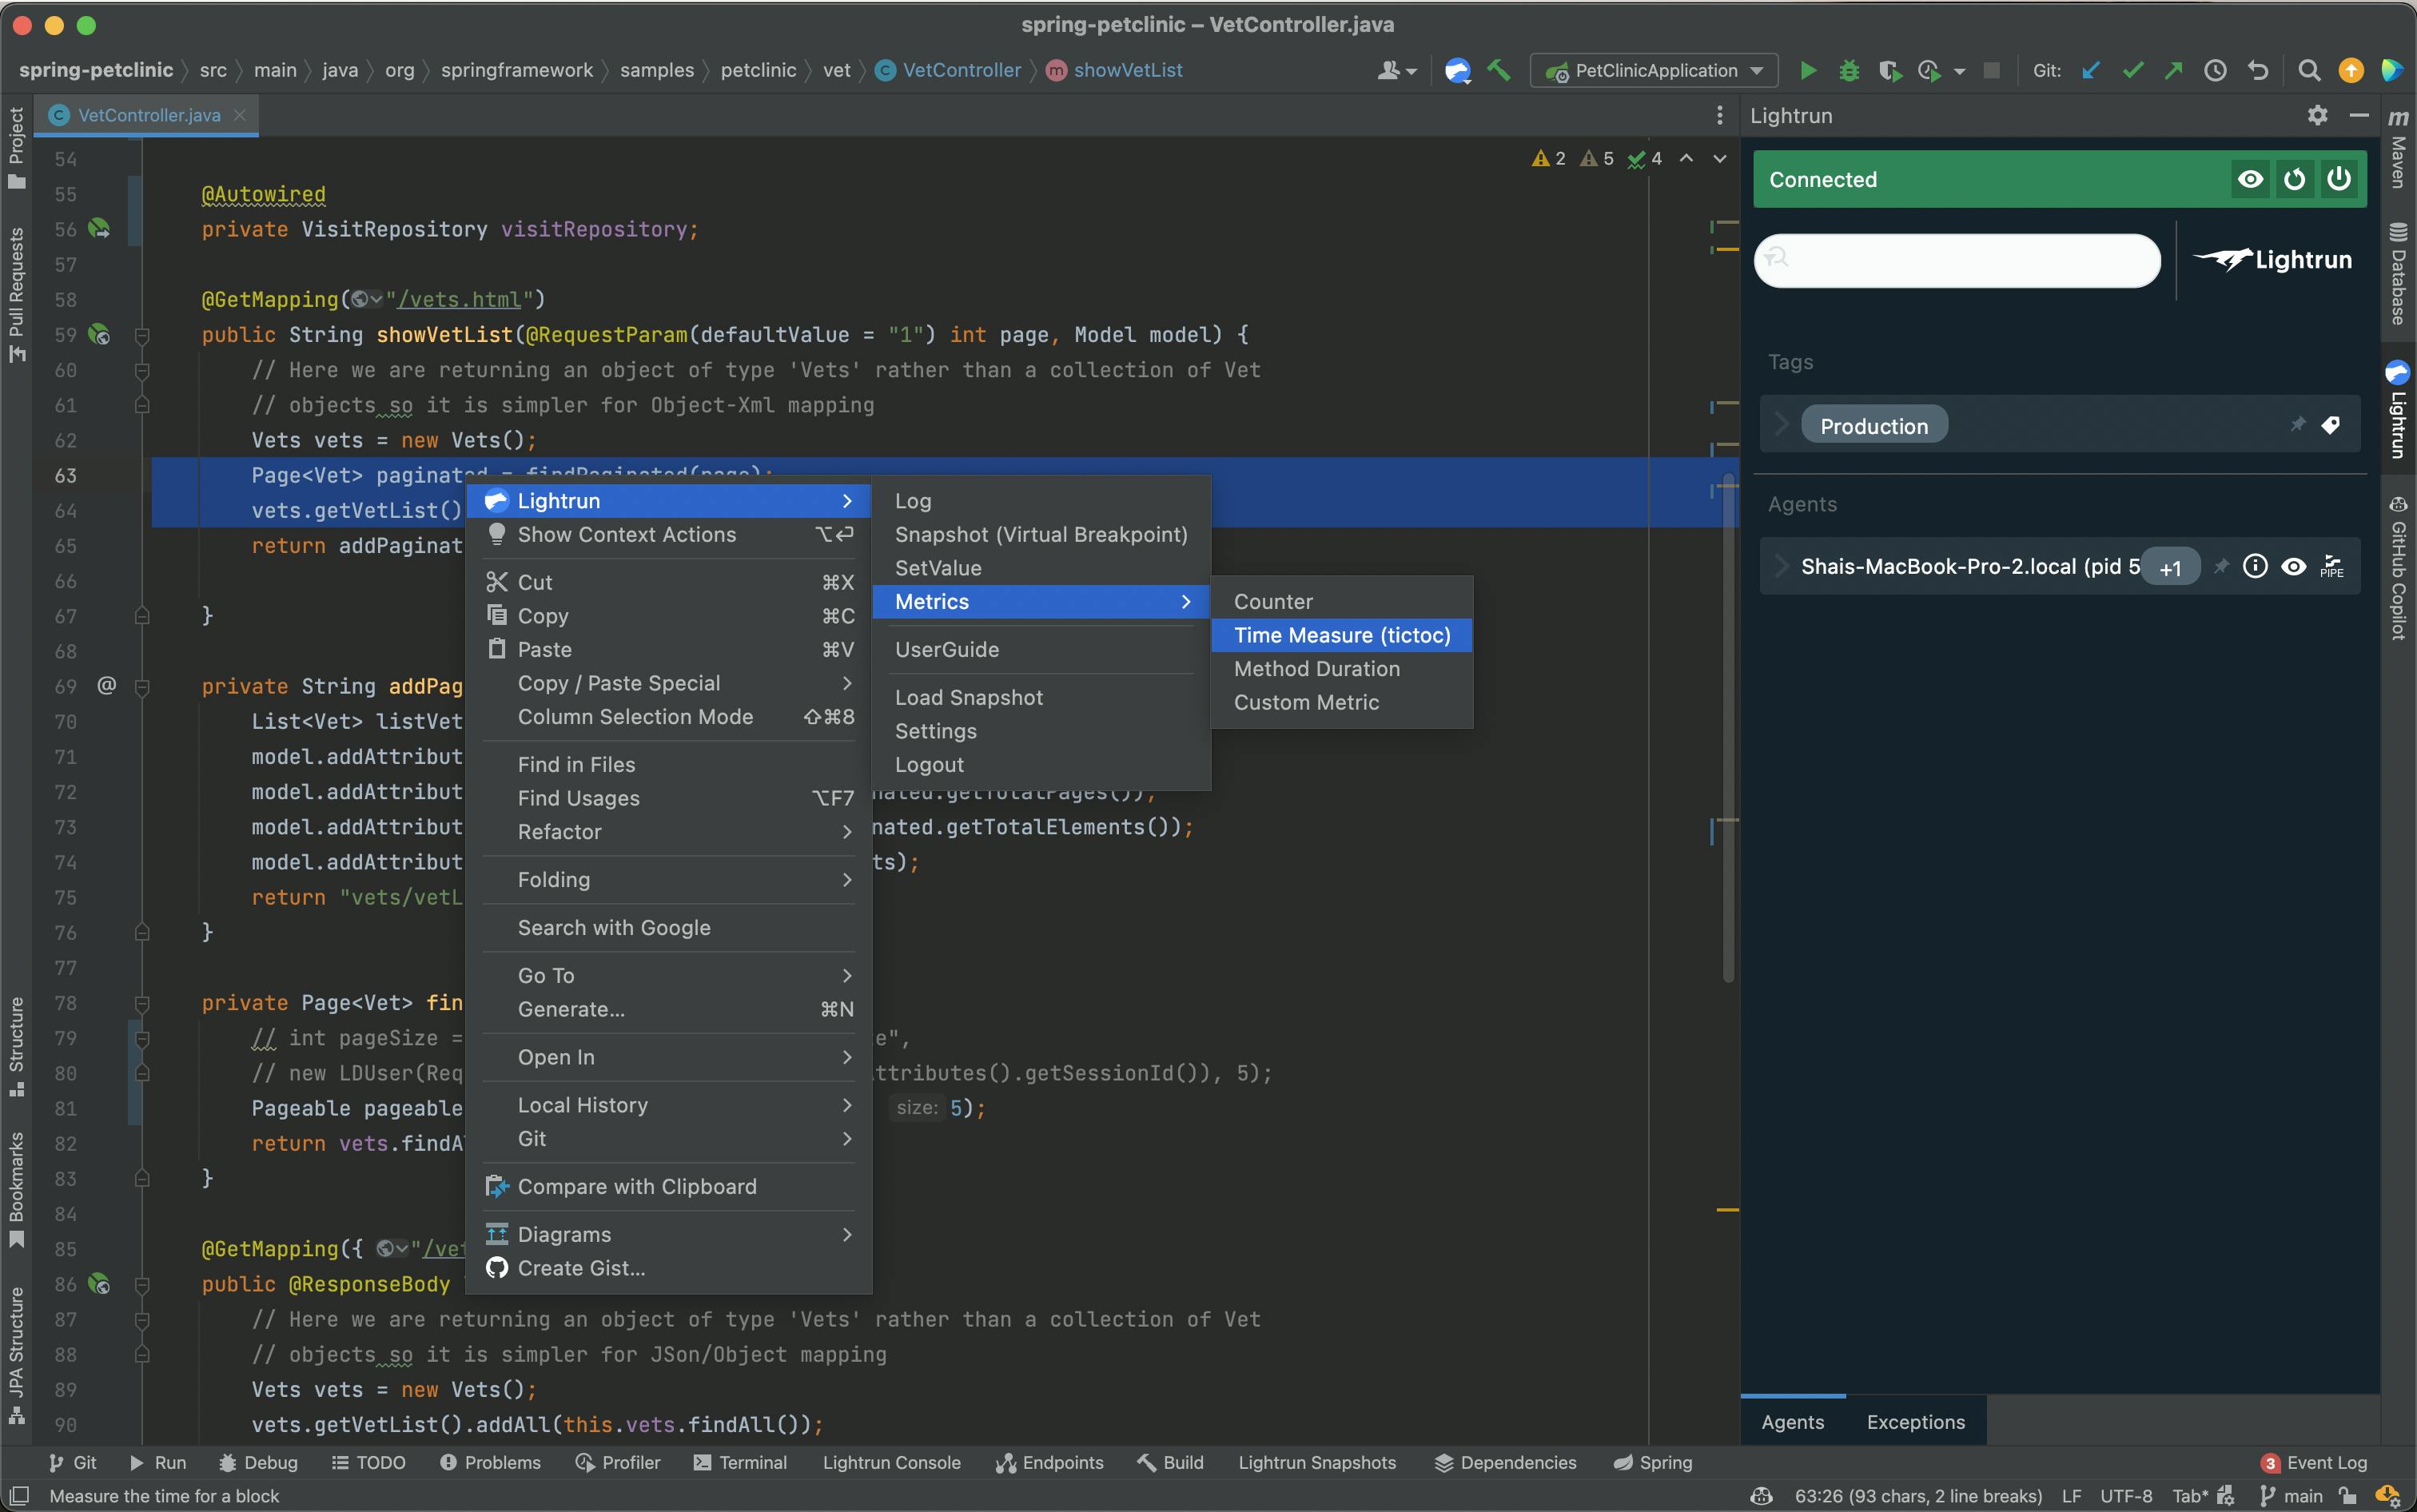
Lightrun includes the ability to set several metric types:
- A counter which counts the amount of times a specific line of code is reached
- Time measure (tictoc) which measures the performance of a specific code block
- Method duration – same as tictoc for a full method
- Custom metric – measure based on a custom expression
Notice that you can use conditions on all metrics. If performance overhead impacts a specific user, you can limit the measurement only to that specific user.
We can now use these tools to narrow down performance problems and find the root cause, e.g. here I can check if these two lines in the method are at fault:
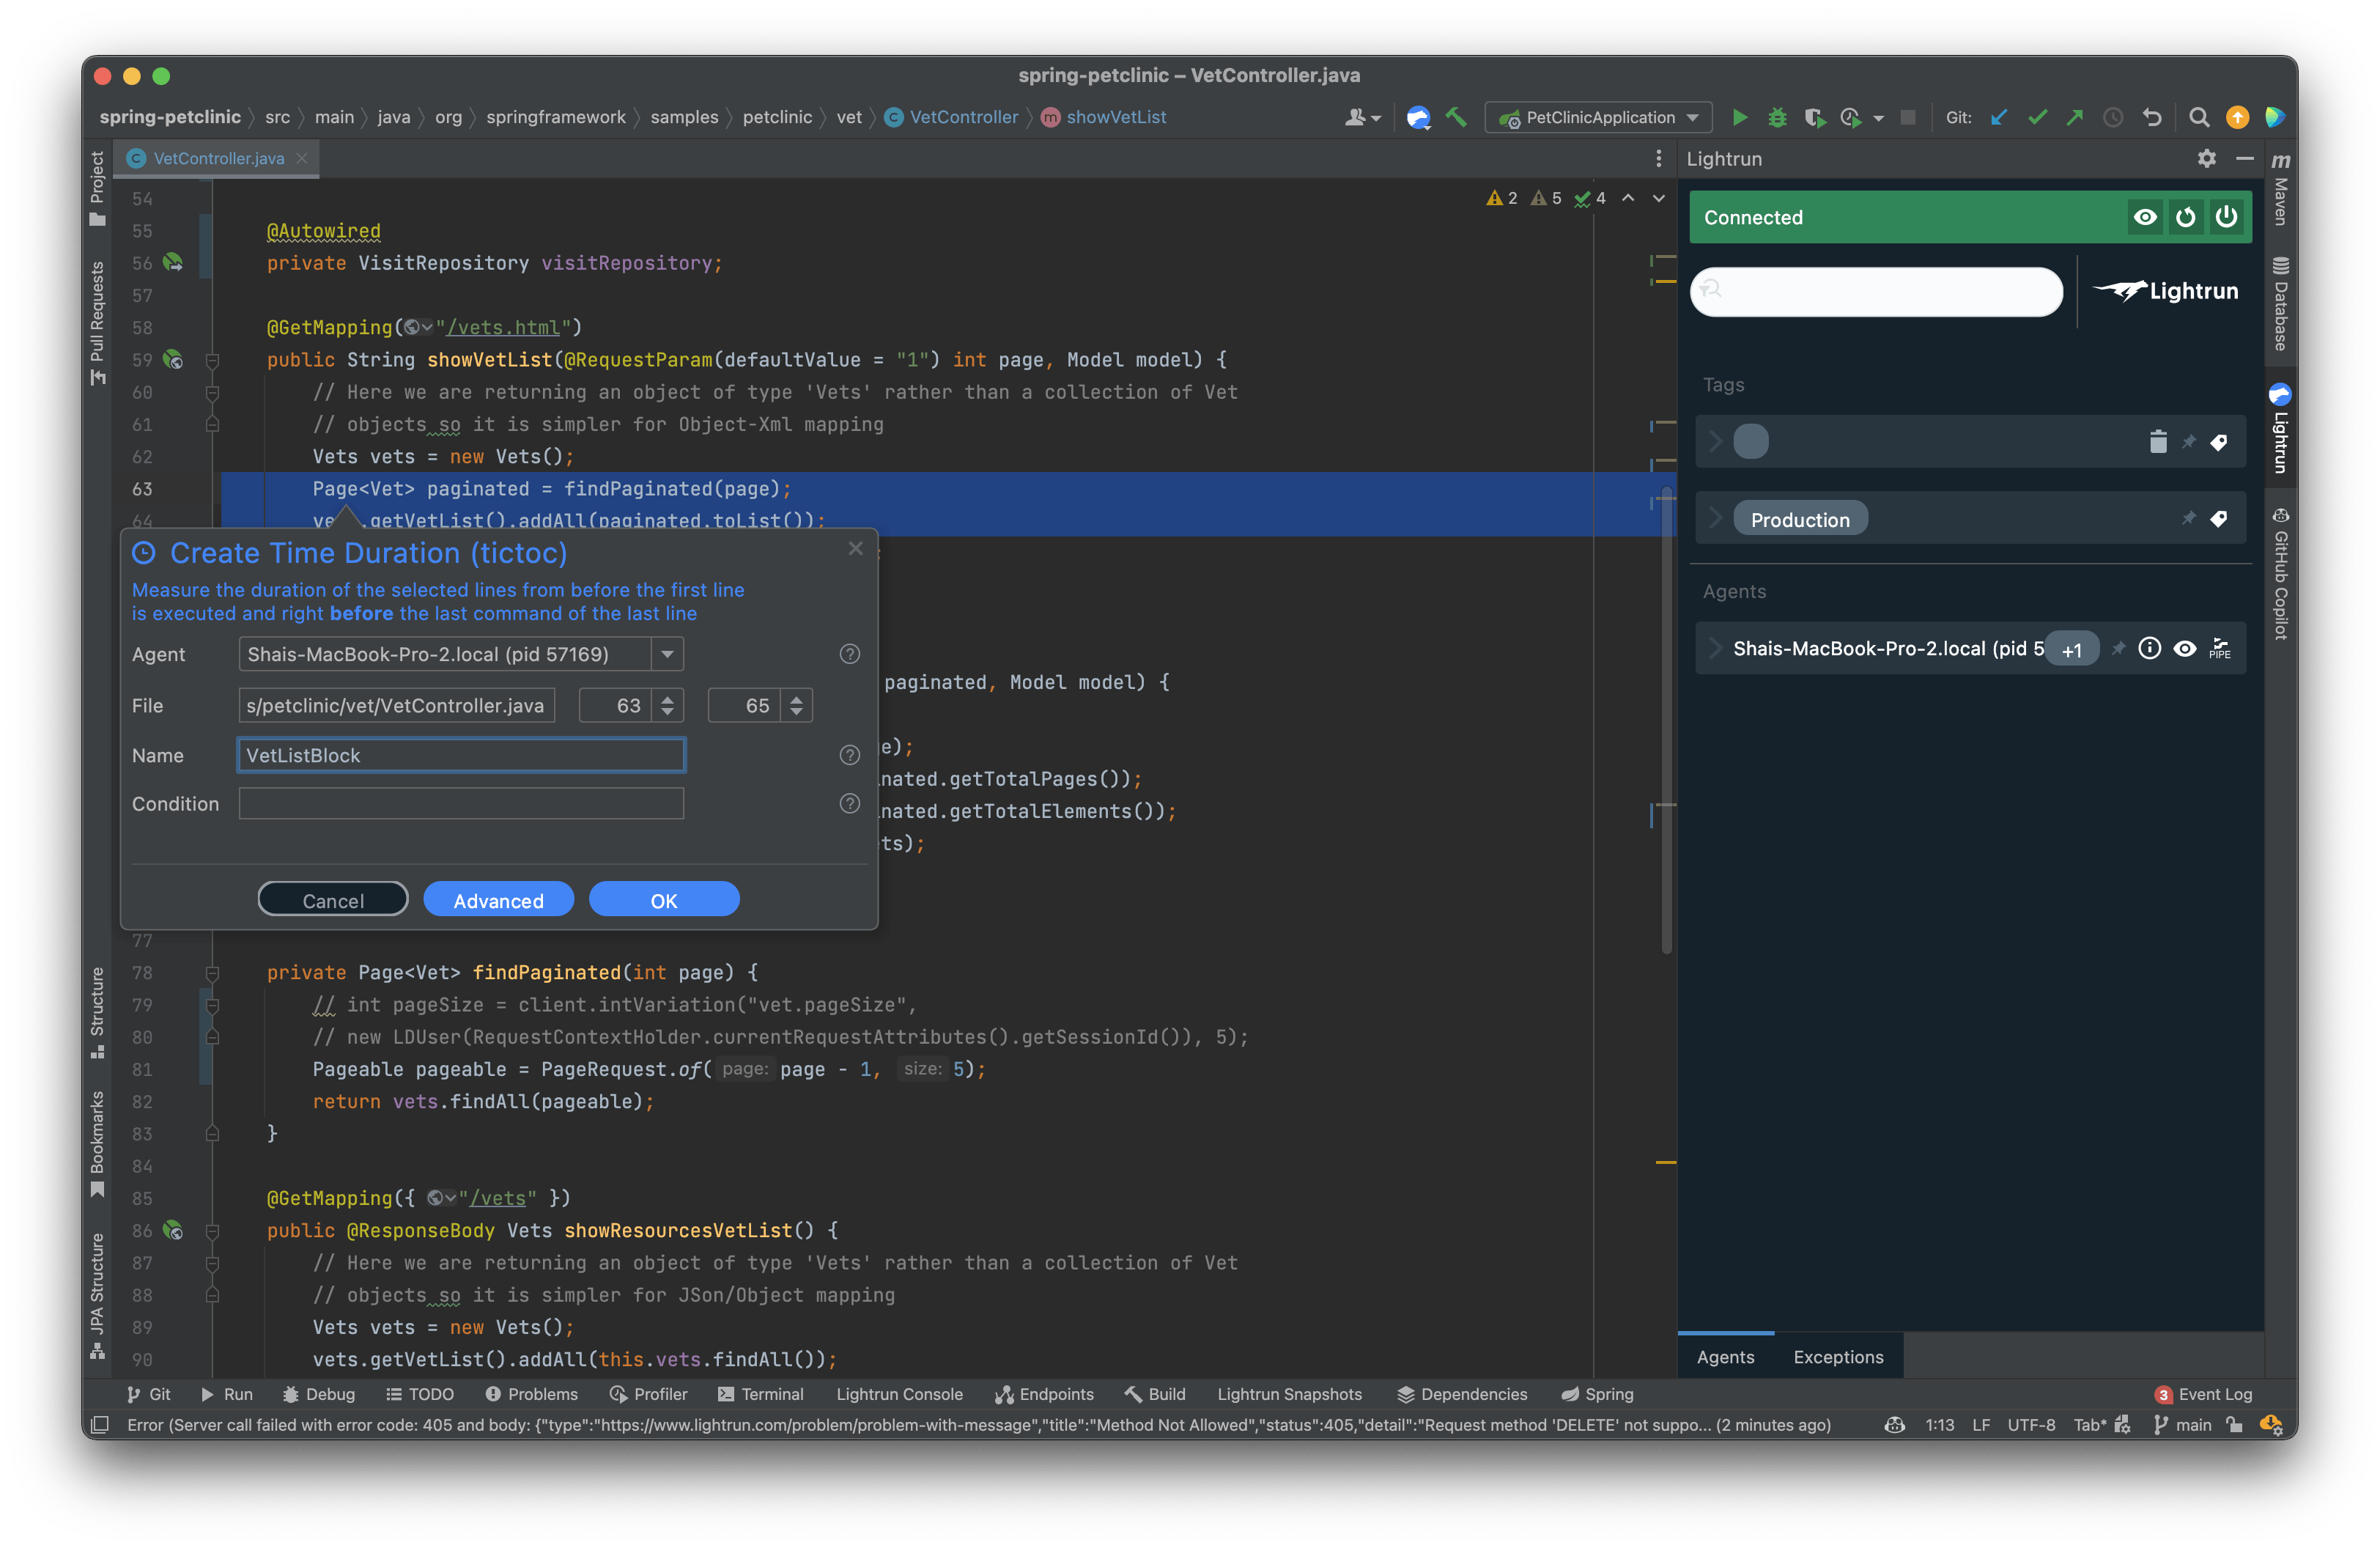
Adding this tictoc provides us with periodical printouts like this:
INFO: 13 Feb 2022, 14:50:06 TicToc Stats::
{
  "VetListBlock" : {"breakpointId" : "fc27d745-b394-400e-83ee-70d7644272f3","count" : 33,"max" : 32,"mean" : 4.971277332041485,"min" : 1,"name" : "VetListBlock","stddev" : 5.908043099655046,"timestamp" : 1644756606939  }
}
You can review these printouts to get a sense of the overhead incurred by these lines. You can also use the counter to see the frequency at which we invoke a method.
NOTE: You can pipe these results to Prometheus/Grafana for better visualization, but that requires some configuration that’s outside of the scope of this tutorial.
If you see a collection or map as the main performance penalty in the application, it’s very possible that a wayward hash code or equals method are at fault. At this point, you can use metrics in the method itself to gauge its overhead.
This is very similar to the way in which we would often debug these things locally. Surround a suspect area by measurements and rerun the test. Unfortunately, that approach is slow as it requires recompiling/deploying the app. It’s also impractical in production. With this approach we can quickly review all the “suspicious” areas and narrow them all down quickly.
Furthermore, we can do that on a set of servers using the tag feature. In this way we can scale our measurements as we scale our servers.
Checking Thread Safety
Mutable objects can be changed from multiple threads while we try to debug them. This might trigger problems that appear to be performance issues. By verifying that we have single thread access, we can also reduce synchronization in critical sections.
E.g. in a key values store, if a separate thread mutates the key, the store might get corrupted.
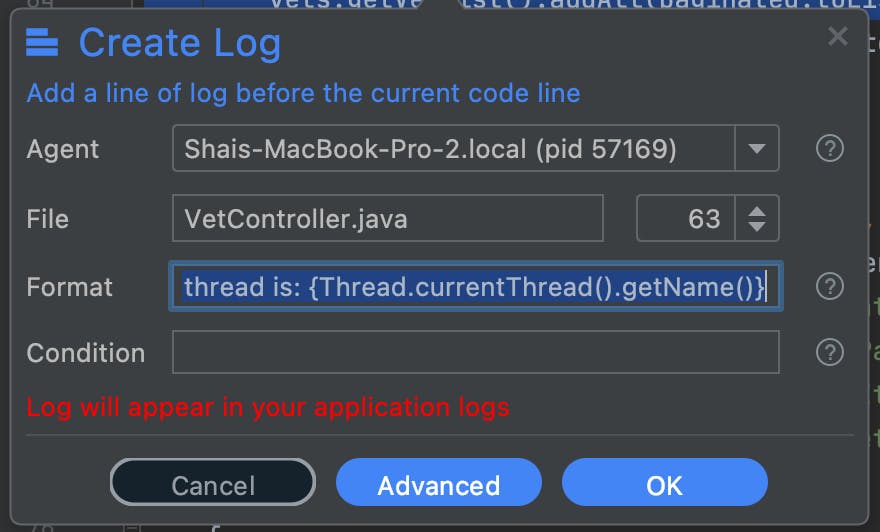
The simplest way to do this is log the current thread using the condition Current thread is: {Thread.currentThread().getName()}:
The problem is that a condition like this can trigger output that’s hard to follow, you might see hundreds of printouts. So once we find out the name of the thread, we can add a condition:
!Thread.currentThread().getName().equals("threadName")
This will only log access from different threads. This is something I discussed in my previous post here.
TL;DR
The performance metrics of the equals and hashcode methods in Java SE are crucial. They have a wide reaching impact on the Java collection API, especially in the key values related calls. Objects must implement this efficiently, but it’s often hard to determine the Java class that’s at fault.
We can use Lightrun metrics to time arbitrary methods in production. It’s important to measure class performance in the “real world” environment, which might differ from our local test cases. Objects can behave radically differently with production scale data, and minor changes to a class can make a big difference..
We can narrow down the overhead of hashes, use logs to determine threading issues, and use counters to determine usage of an API.