

Debugging the Java Message Service (JMS) API using Lightrun
Due to their asynchronous nature and production complexities debugging messaging systems is remarkably hard... WAS remarkably hard...


Table of contents
The Java Message Service API (JMS) was developed by Sun Microsystems in the days of Java EE. The JMS API provides us with simple messaging abstractions including Message Producer, Message Consumer, etc. Messaging APIs let us place a message on a “queue” and consume messages placed into said queue. This is immensely useful for high throughput systems – instead of wasting user time by performing a slow operation in real-time, an enterprise application can send a message. This non-blocking approach enables extremely high throughput, while maintaining reliability at scale.
The message carries a transactional context which provides some guarantees on deliverability and reliability. As a result, we can post a message in a method and then just return, which provides similar guarantees to the ones we have when writing to an ACID database.
We can think of messaging somewhat like a community mailing list. You send a message to an email address which represents a specific list. Everyone who subscribes to that list receives that message. In this case, the message topic represents the community mailing list address. You can post a message to it, and the Java Message Service handler can use a message listener to receive said event.
It’s important to note that there are two messaging models in JMS: the publish-and-subscribe model (which we discussed here) and also point-to-point messaging, which lets you send a message to a specific destination.
Let’s go over a quick demo.
A Simple Demo
In order to debug the Java Message Service calls, I’ve created a simple demo application, whose source code can be found here.
This JMS demo is a simple database log API – it’s a microservice which you can use to post a log entry, which is then written to the database asynchronously. RESTful applications can then use this database log API to add a database log entry and without the overhead of database access.
This code implements the main web service:
@RestController
@RequiredArgsConstructor
public class EventRequest {
   private final JmsTemplate jmsTemplate;
   private final EventService eventService;
   private final Moshi moshi = new Moshi.Builder().build();

   @PostMapping("/add")
   public void event(@RequestBody EventDTO event) {
       String json = moshi.adapter(EventDTO.class).toJson(event);
       jmsTemplate.send("event", session ->
               session.createTextMessage(json));
   }

   @GetMapping("/list")
   public List<EventDTO> listEvents() {
       return eventService.listEvents();
   }
}
Notice the event() method that posts a message to the event topic. I didn’t discuss message bodies before to keep things simple, but note that in this case I just pass a JSON string as the body. While JMS supports object serialization, using that capability has its own complexities and I want to keep the code simple.
To complement the main web service, we’d need to build a listener that handles the incoming message:
@Component
@RequiredArgsConstructor
public class EventListener {
   private final EventService eventService;

   private final Moshi moshi = new Moshi.Builder().build();

   @JmsListener(destination = "event")
   public void handleMessage(String eventDTOJSON) throws IOException {
       eventService.storeEvent(moshi.adapter(EventDTO.class).fromJson(eventDTOJSON));
   }
}
The listener is invoked with the JSON string that is sent to the listener, which we parse and send on to the service.
Debugging the Hidden Code
The great thing about abstractions like Spring and JMS is that you don’t need to write a lot of boilerplate code. Unfortunately, message-oriented middleware of this type hides a lot of fragile implementation details that can fail along the way.
This is especially painful in a production scenario where it’s hard to know whether the problem occurred because a message wasn’t sent properly. This is where Lightrun comes in.
You can place Lightrun actions (snapshots, logs etc.) directly into the platform APIs and implementations of messaging services. This lets us determine if message selectors are working as expected and whether the message listener is indeed triggered.
With Spring with JMS support as shown above, we can open the JmsTemplate and add a snapshot to the execute method:
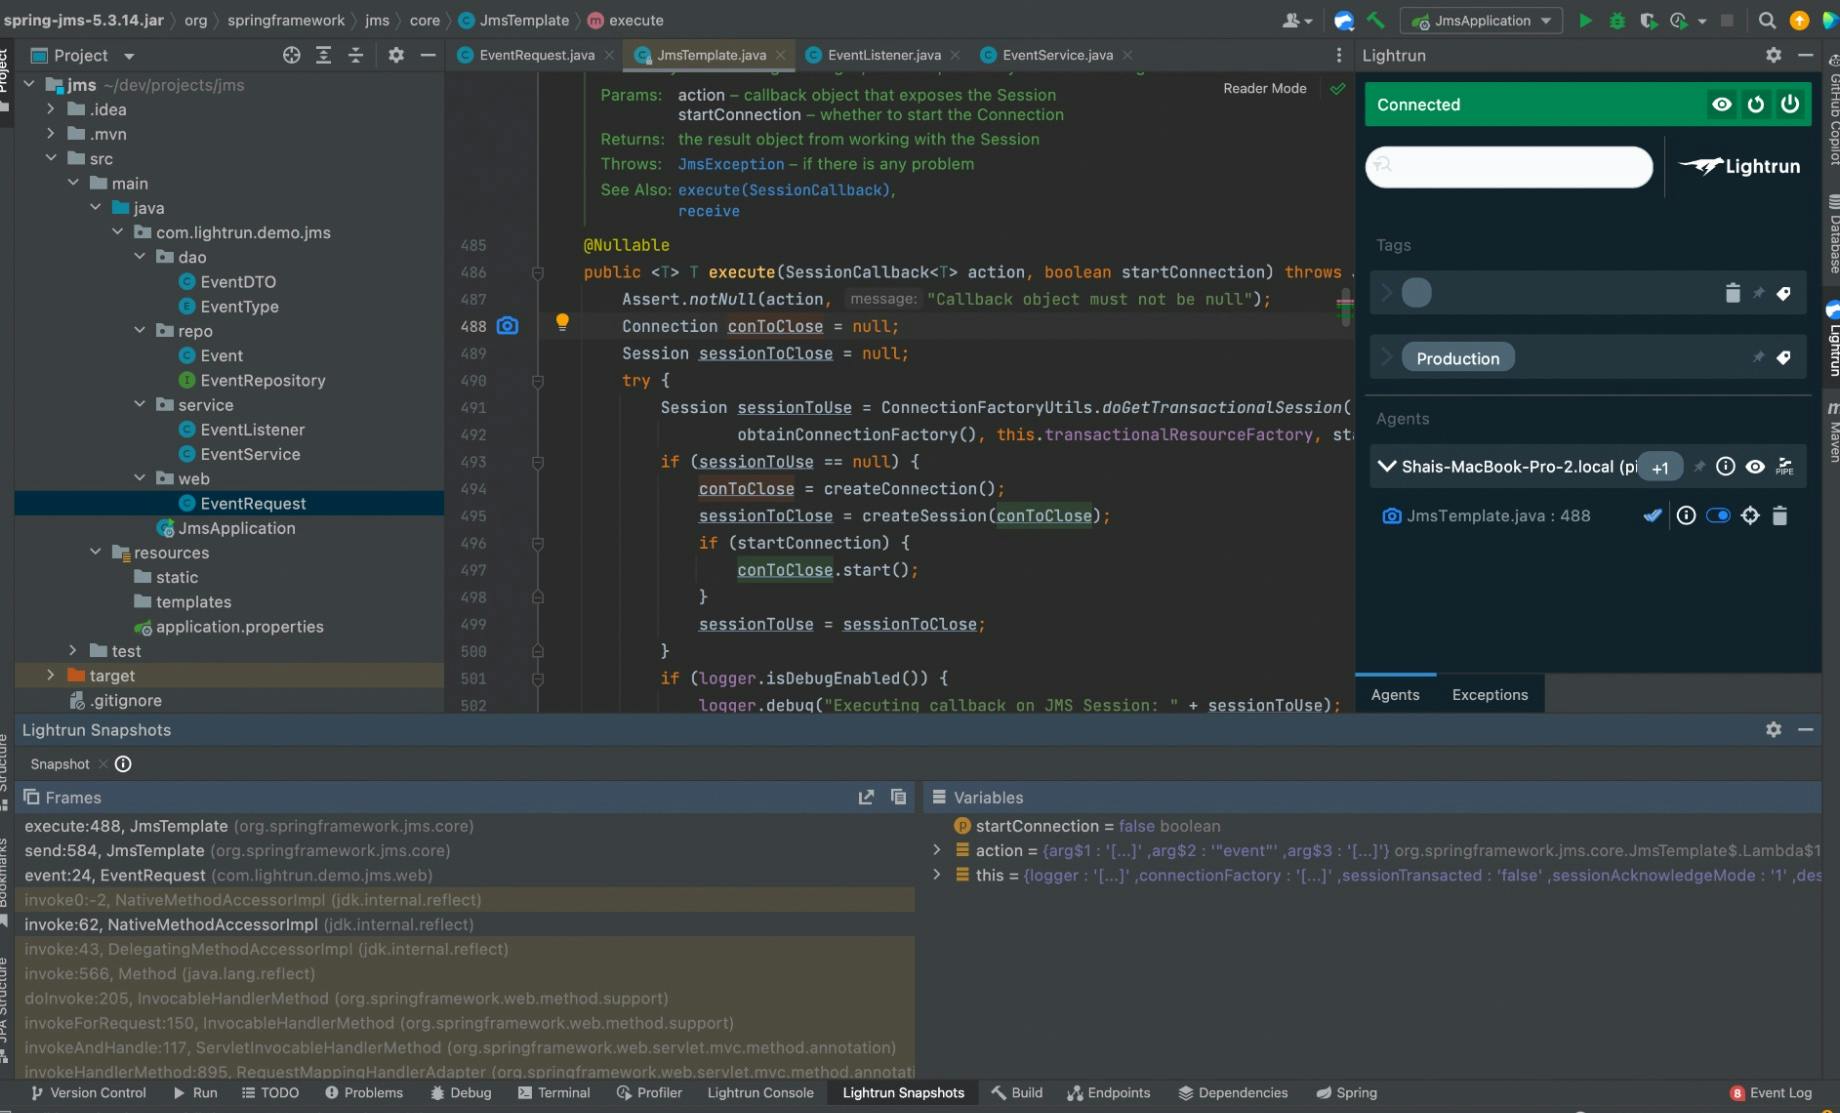
As you can see, the action is invoked when sending to a topic. We can review the stack frame to see the topic that receives the message and use conditions to narrow down the right handler for messages.
We can place a matching snapshot in the source of message so we can track the flow. E.g. a snapshot in EventRequest can provide us with some insight. We can dig in the other direction too.
In the stack above, you can see that the execute method is invoked by the method send at line 584. The execute method wraps the caller so the operation will be asynchronous. We can go further down the stack by going to the closure and placing a snapshot there:
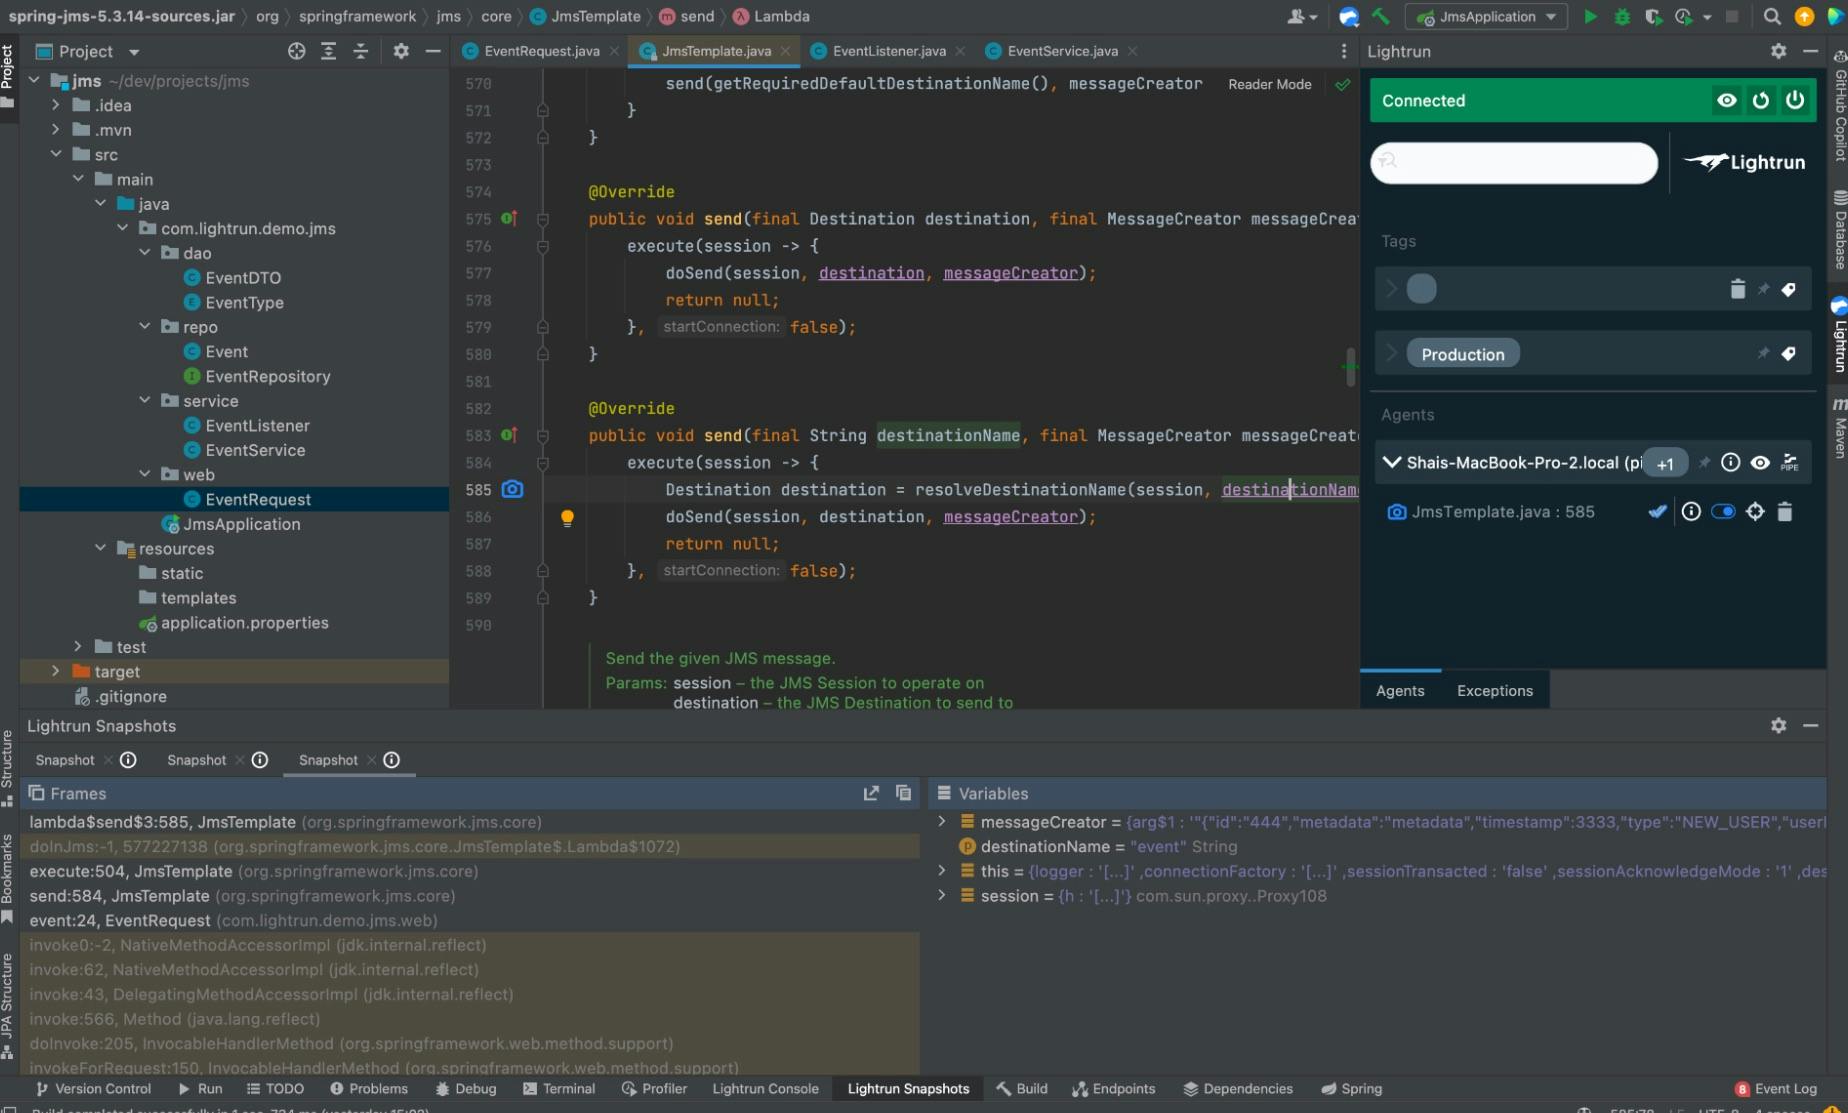
Notice that here we can place a condition on the specific topic and narrow things down.
TL;DR
We pick messaging systems to make our application reliable. However, enterprise messaging systems are very hard to debug in production, which works against that reliability. We can see logs in the target of messages, but what happens if we did not reach it?
With Lightrun we can place actions in all the different layers of messaging-based applications. This helps us narrow down the problem regardless of the messaging standard or platform. You can accomplish all of this using the free tier.