


Debugging Tutorial 1 – Introduction: Conditional Breakpoints
First post in a (hopefully) long series covering everything you need to know about debugging in VSCode, IntelliJ/IDEA in Java, NodeJS, Kotlin & Python


In this series I’ll walk you through the process of debugging applications and finding issues within them. As we debug we’ll cover the techniques important for most developers. I will cover the following debuggers:
- IntelliJ/IDEA – with Java/Kotlin
- PyCharm – Python
- VSCode – for JavaScript
- WebStorm – for JavaScript
These should cover most use cases you’ll run into and some things will seem duplicate/redundant so you can just skip to the applicable section if you feel you “got the gist”.
Notice that while I won’t cover TypeScript, everything discussed in the JavaScript tutorial is applicable to TypeScript too. The same applies to most JVM languages like Scala etc.
Normally people separate these tutorials based on IDE/Language. I think having all of them together is beneficial in providing the “big picture”. We also move through languages/IDEs in our career and having a wider viewpoint is helpful.
In a future post I’d also like to also talk about browser debugging with Chrome DevTools and Firefox Web Developer Tools. However, these are a slightly different process so I’ll leave them out for now.
I also included a video tutorial highlighting the steps visually. This might help if my instructions are unclear:
Motivation
The main goal in this series is to bring you up to speed so we can dig into the real interesting tutorials near the end. The first part might seem a bit trivial since I’m assuming zero knowledge of debugging techniques but I plan to get in-depth with these posts as we move forward.
But you might be asking yourself, why even go through this?
Why do we need to go through a debugging tutorial? I already know programming and using a debugger isn’t exactly rocket science…
Well… We spend 50% of our time chasing bugs according to this study , although I saw numbers ranging from 25% to 75%. Unfortunately, this is a skill that Universities don’t really teach. Even at our jobs people gloss over this essential skill. There are books that cover this subject but a lot are out of date and aim at more complex scenarios.
Debugging isn’t just about finding bugs. When I need to implement a new feature in an area of the code I’m unfamiliar with I often pull up the debugger and start debugging those areas. Trying to look at the flow as if I’m debugging an issue. Inspecting the stack, members etc. to gain a better understanding of the way the system works and validate my assumptions.
Getting Started
To get started we need a simple app we can debug in the initial parts of this tutorial. For this we’ll use Prime Main which calculates prime numbers. It’s a trivial app which you can just fetch and open in your IDE.
Notice that the apps are specifically unoptimized and verbose to give us more places to place breakpoints and step over.
Here are versions of it for the various languages:
- Java – gist.github.com/shai-almog/e400134f01decc96..
- Kotlin – gist.github.com/shai-almog/c454d39464ca2893..
- Python – gist.github.com/shai-almog/8c8bbbb4297f758f..
- JavaScript – gist.github.com/shai-almog/167a34571b0fae6e..
Download the appropriate source file and add it as the main source file in a new project in your IDE. You can run the application but take in mind that it will run for a VERY long time searching for prime numbers.
Simple Conditional Breakpoint
First we need to debug the app. In IDEs from JetBrains we just right click the executable file and select debug as such:
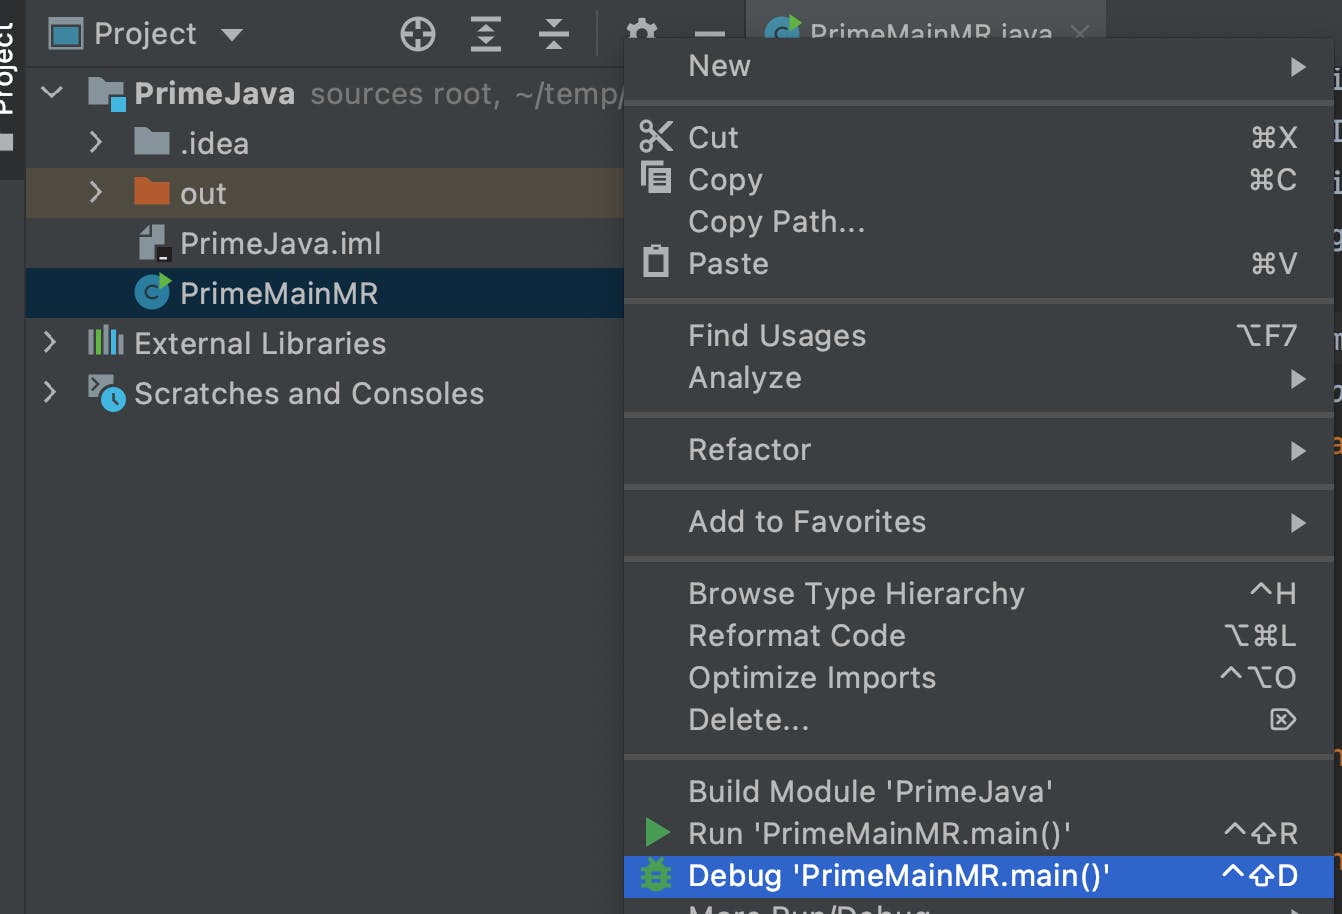
Please notice you might need to wait for the IDE to finish scanning and indexing the files so it will show the appropriate debug action.
The same is true for VSCode. Select the debug view on the left of the IDE and click the “Run and Debug” button.
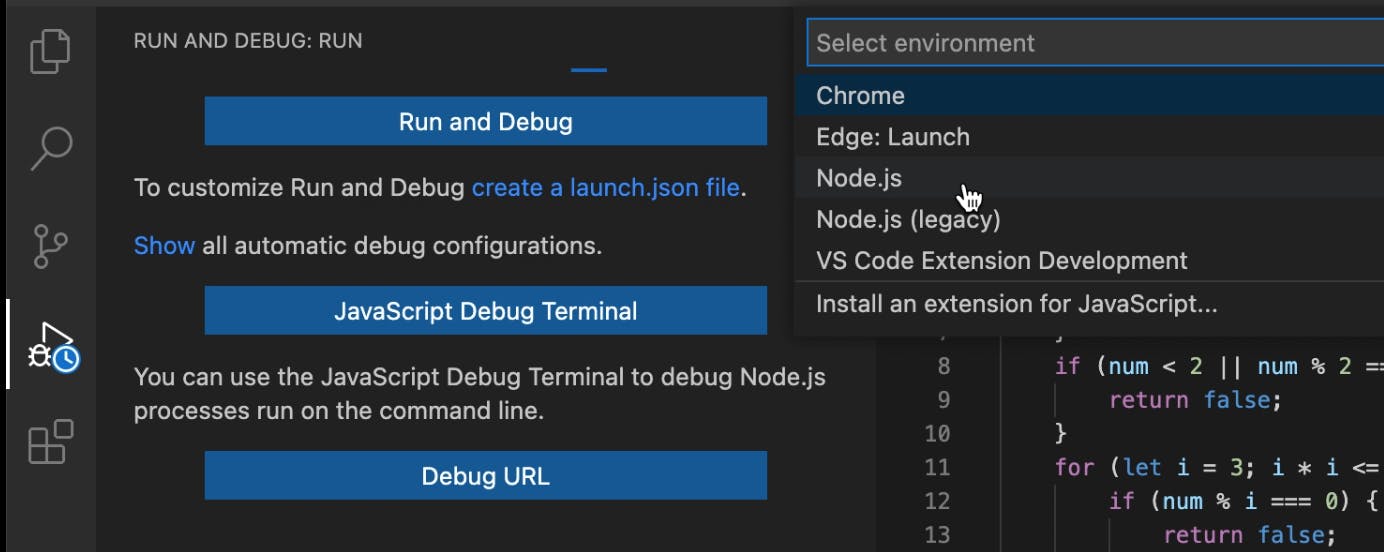
You will be prompted with an environment to use, pick Node.js to continue.
Once you start debugging you can set a breakpoint by clicking once on the “gutter” area to the left of the file. Let’s do a quick experiment for every file type/IDE.
Running
 Running on JetBrains IntelliJ/IDEA
 Running on VSCode
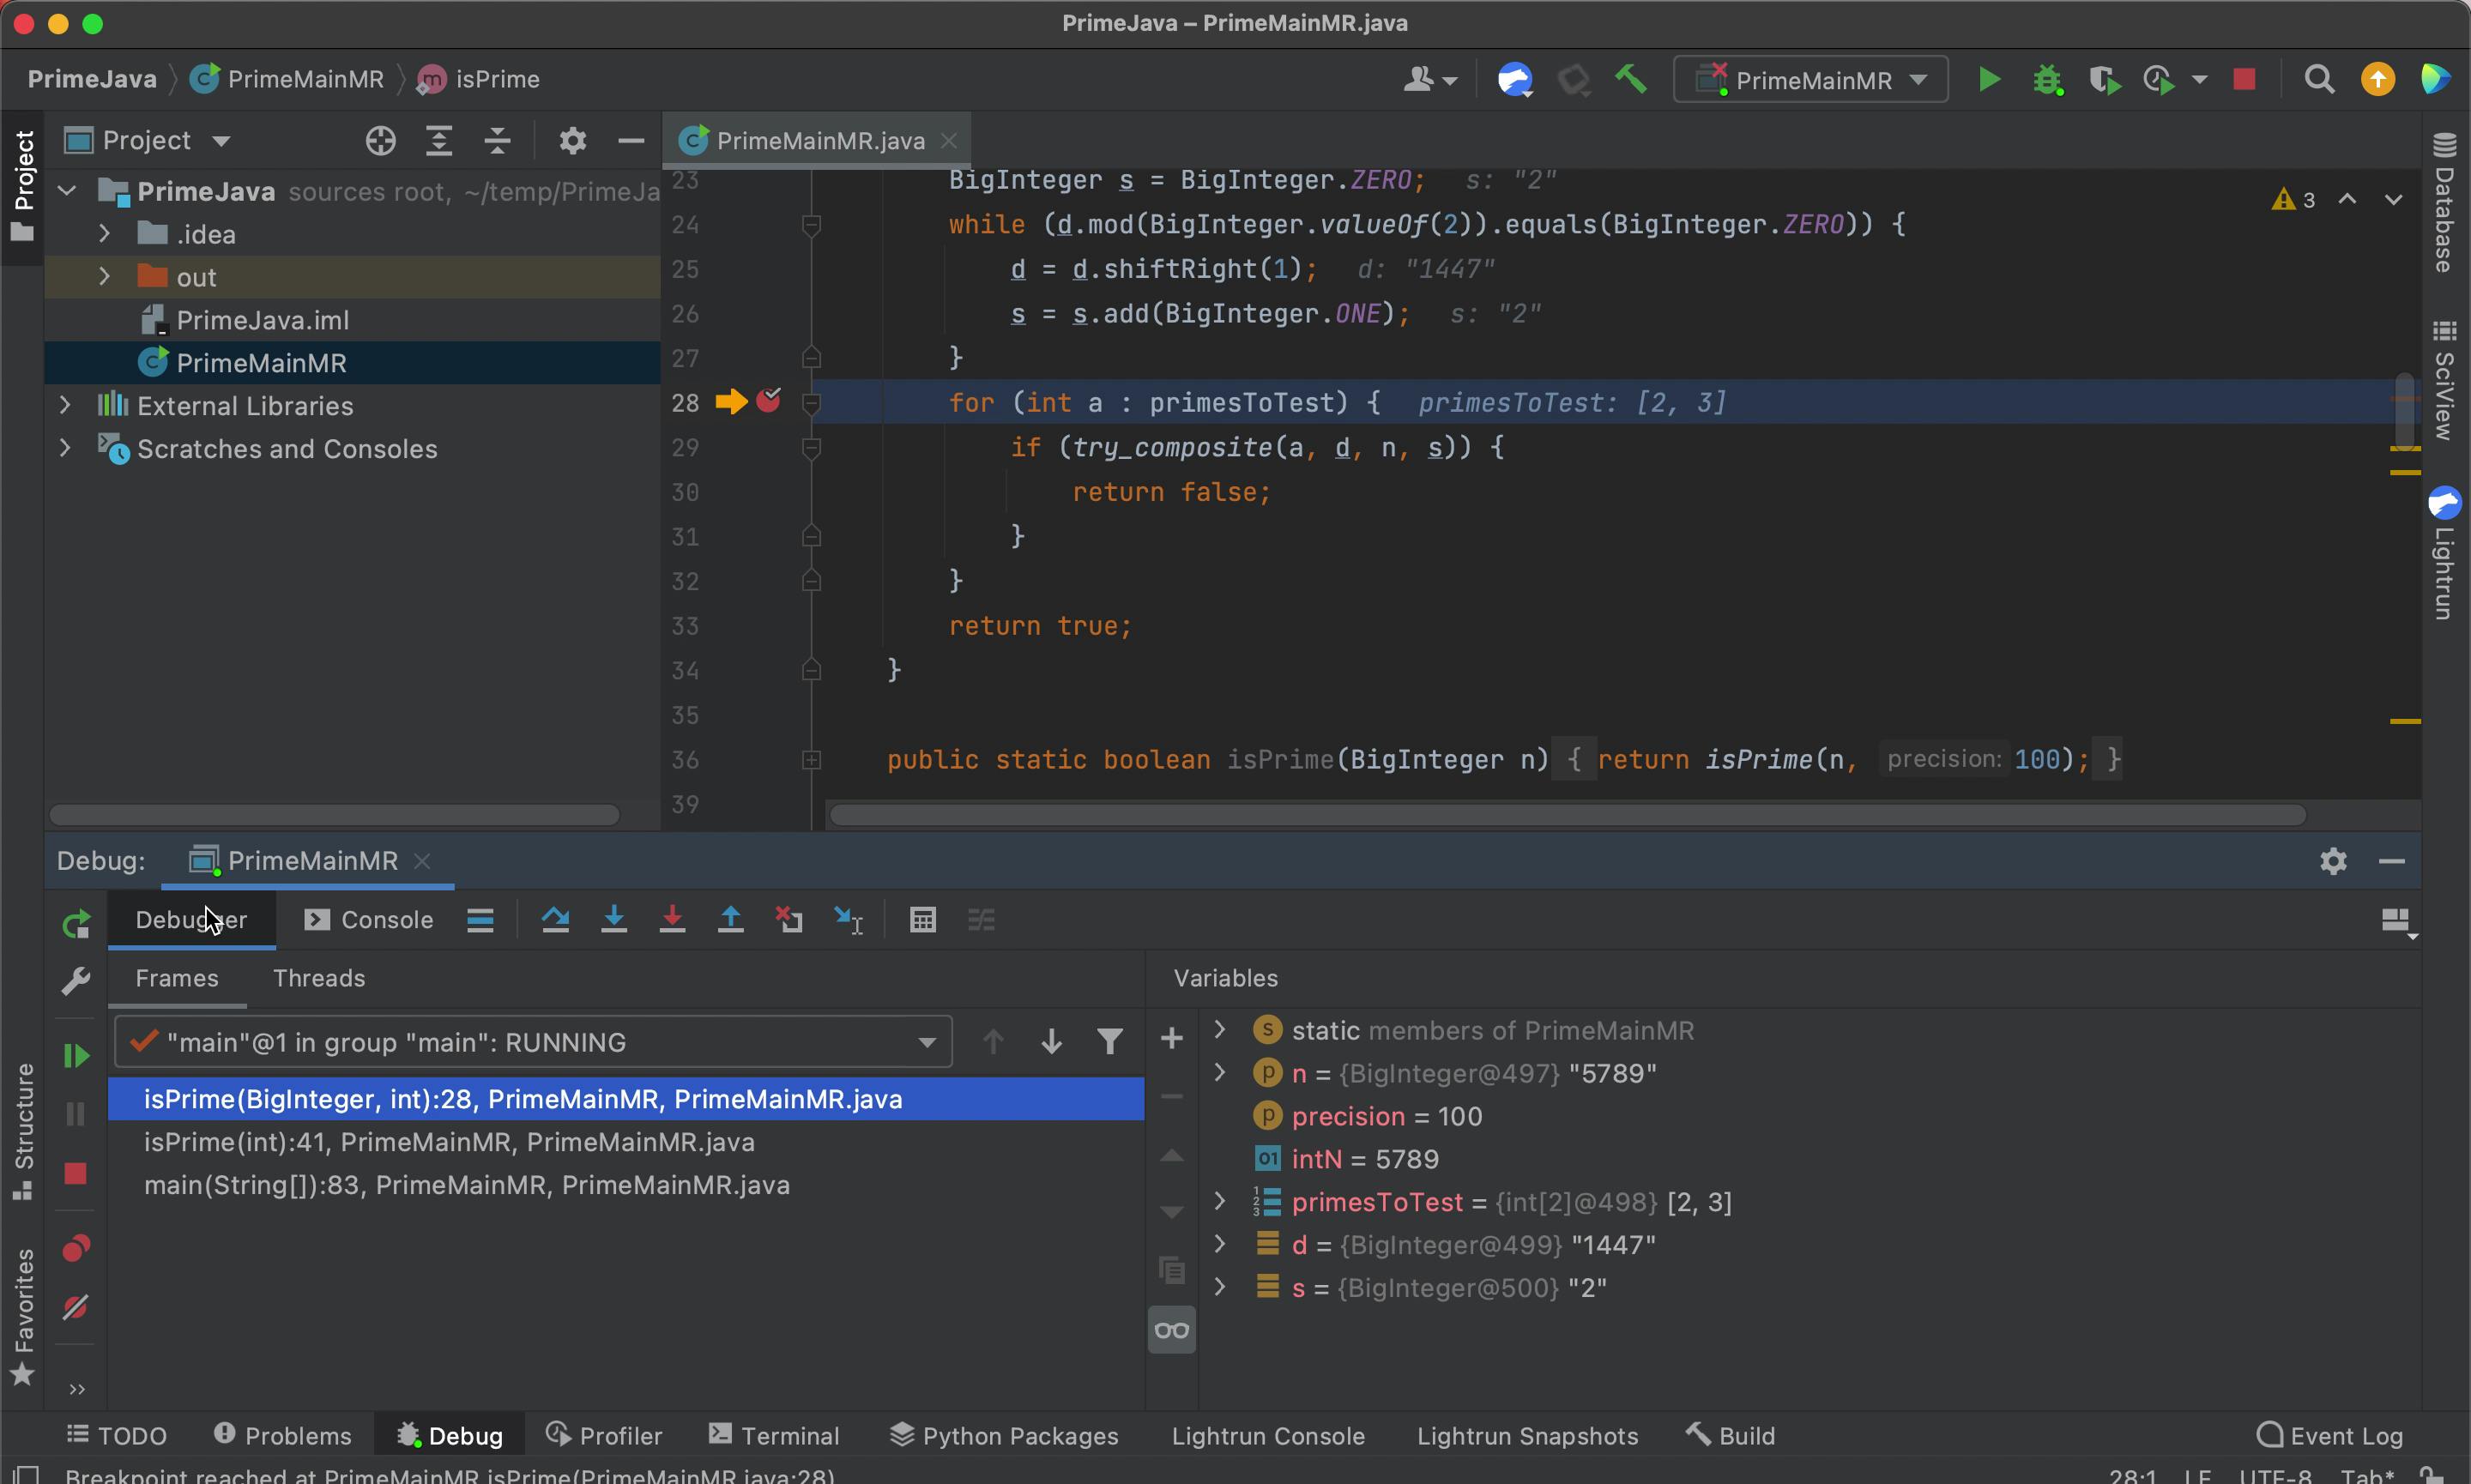
We place a breakpoint on line in the file. Notice that the Java file is more elaborate than the other Prime Main files:
- For Java place the breakpoint at line 28
- For Kotlin line 21
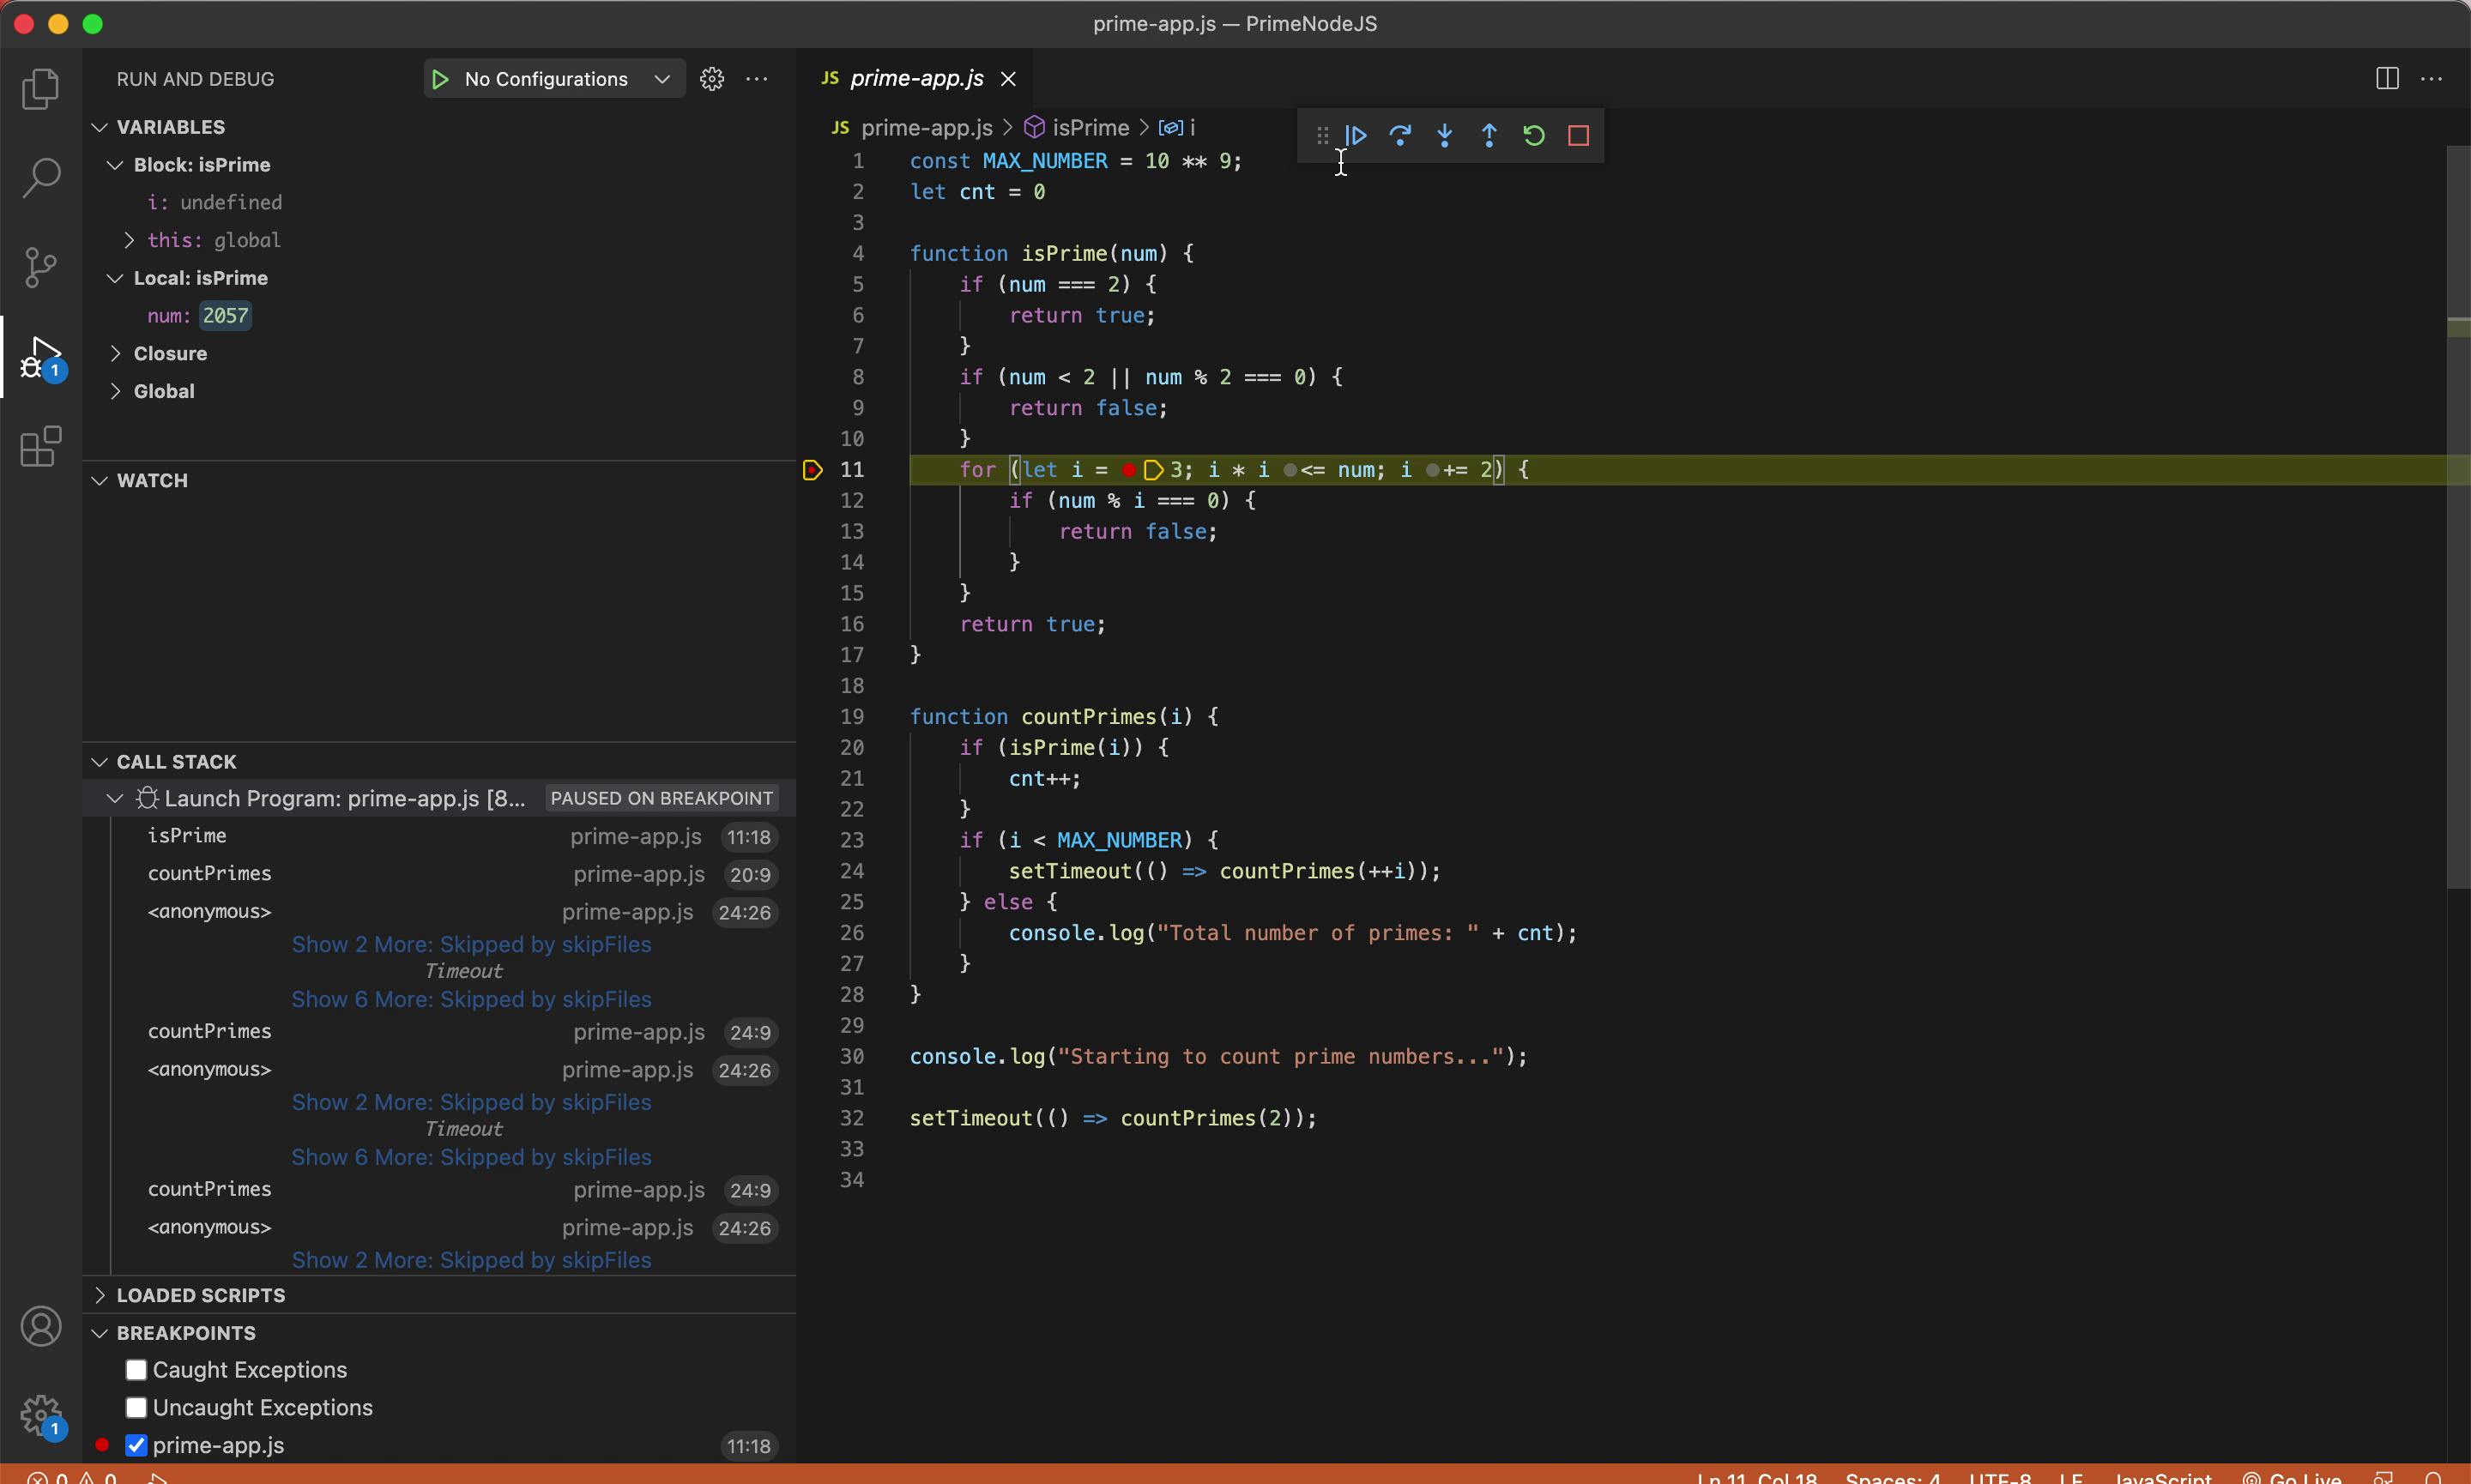
- For JavaScript line 11
- For Python line 11
Once the breakpoint is hit you should be able to see the stack trace on the bottom left. The stack trace represents the methods that invoked the current method. At the top of the stack you see the current method. You can click on each “stack frame” to go to see the caller and the state of the variables within the caller frame.
On the bottom right (for JetBrains) or the top left for VSCode, you can see the variables in the current stack frame. Notice n which is the number we’re calculating. Notice it isn’t a primitive but rather a BigInteger which we use to support fantastically large numbers in Java (numbers potentially larger than 9,223,372,036,854,775,807 which is the limit of Long).
We can change the values of variables using the “Set Value” feature:
 Setting Value in JetBrains
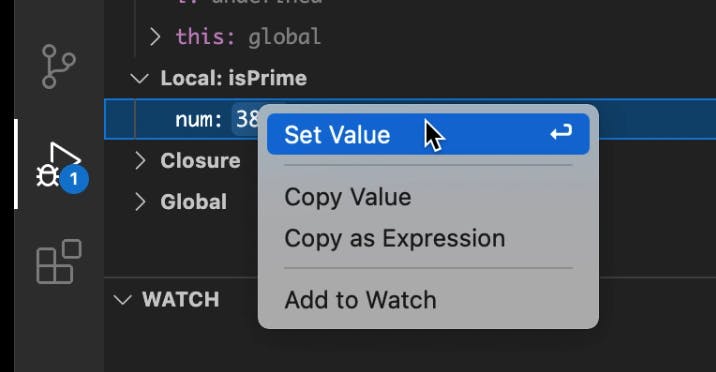 Setting Value in VSCode
This is extremely helpful for debugging edge cases. Just set the variable to the value you’re having trouble with and reproduce the issue.
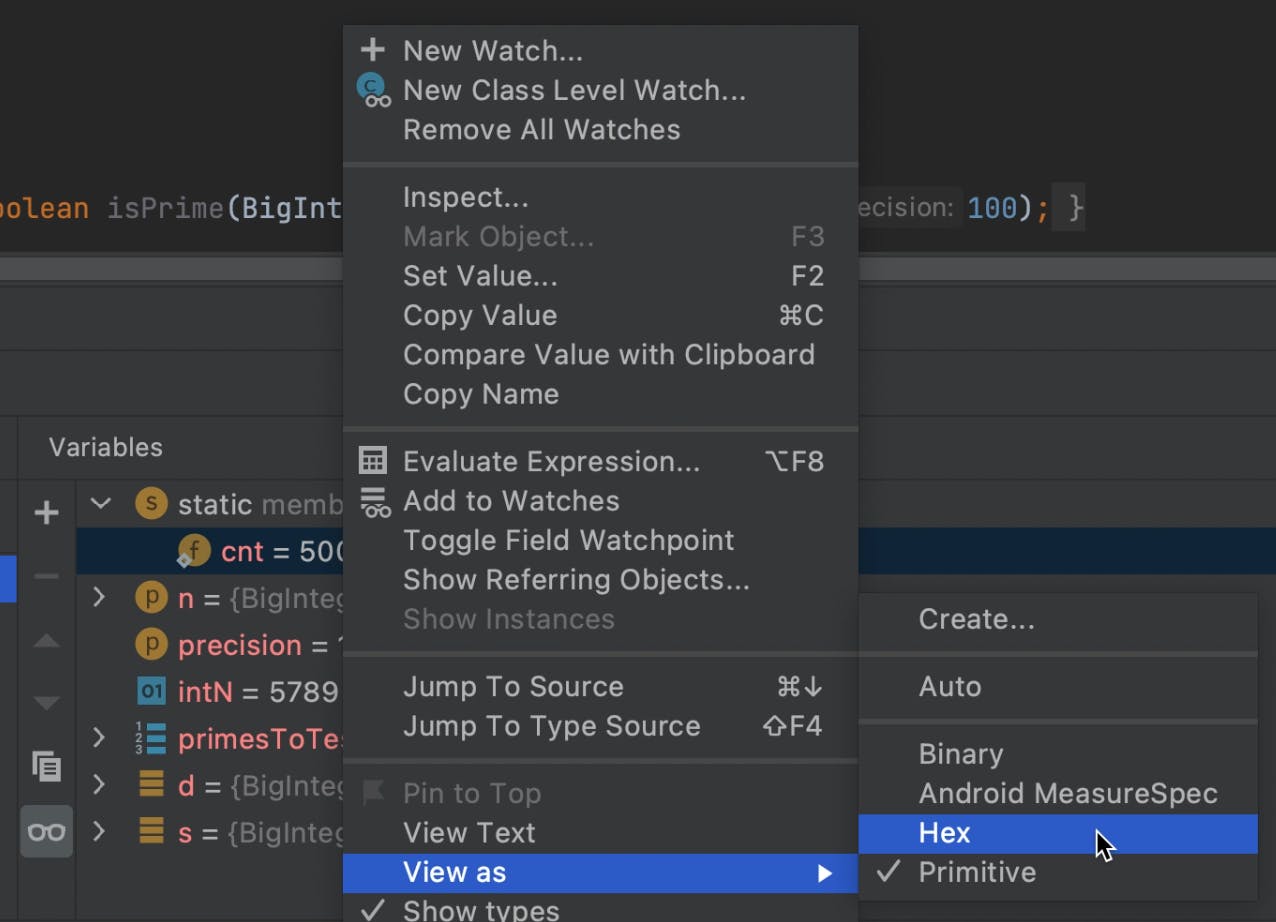
A nice JetBrains feature lets you view a value differently e.g. as hex, binary etc.:
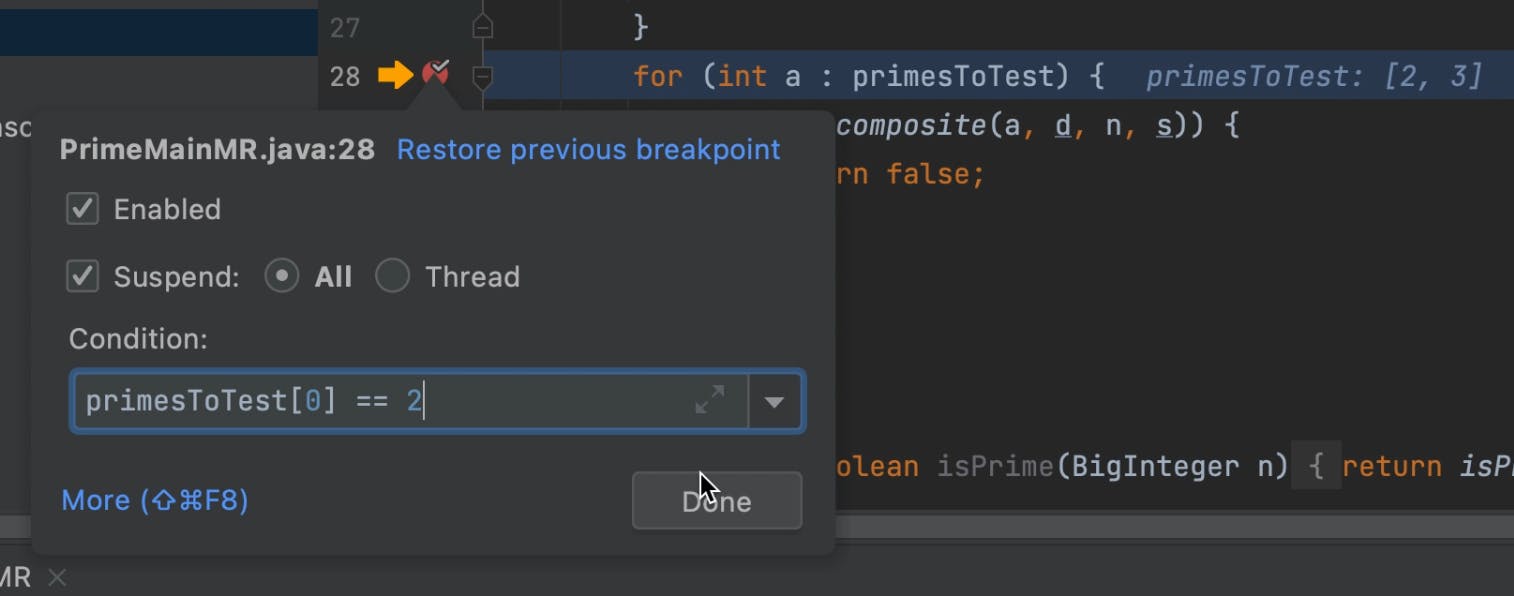
Finally we can right click on the breakpoint to edit it. We can set a condition for the breakpoint which will make execution stop only if the condition is met:
 Conditional Breakpoint in JetBrains on IntelliJ/IDEA
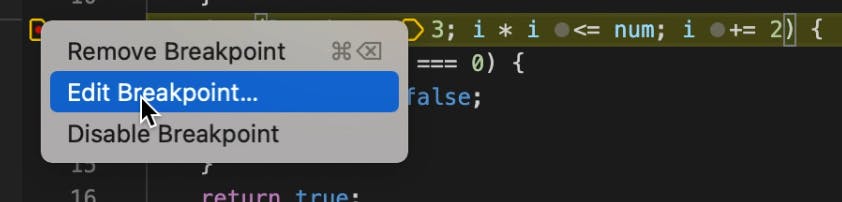 Conditional Breakpoint is added via Edit Breakpoint in VSCode
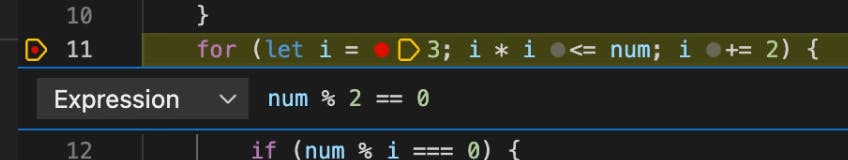 Conditional Breakpoint Editing in VSCode
Since the Java code is a bit different I used primesToTest[0] == 2 which will always be true. You can try setting it to 3 which will take a long while and you can see that it will only stop at that point.
In the other cases I used num % 2 == 0 as a condition that will always be false. Since the line above that line checks if a number is even which it never will be. Flipping this condition to num % 2 == 1 will always be true and the breakpoint will be hit.
Taking this Further
Conditional breakpoints are one of the most powerful yet sadly under utilized tools in the arsenal of a debugger. When you experience a failure in a loop we often walk over the loop again and again and again… Waiting for the right conditions to materialize.
By using set value or a condition we can move much faster in our debugging process and possibly reproduce issues more accurately without the delays you’d normally see for stepping over.
TL;DR
In this first installment of this series I tried to stress the importance of debugging skills for our daily work. Great developers use their tools effectively and efficiently to increase productivity and the debugger is a complex machine we need to wield effectively. According to some statistics debugging might be as important as our coding skills. Unfortunately even basic features like conditional breakpoints, set value etc. are rarely used by most developers. I hope this and future posts in this series will help change that for you and help you find bugs quickly.