

Debugging Race Conditions in Production
Debugging race conditions is hard, unfortunately production environment is especially problematic for these kinds of problems...


Race conditions can occur when a multithreaded application accesses a shared resource using over one thread. Unless we have guards in place, the result might depend on which thread "got there first". This is especially problematic when the state is changed externally.
A race can cause more than just incorrect behavior. It can enable a security vulnerability when the resource in question can be corrupted in the right way. A good example of race condition vulnerabilities is mangling memory. Let's say we have an admin user name which is restricted and privileged. You can't change your user name to admin because of validation. But you can change it to anything else...
Malicious code can repeatedly set the value to "admix", "xdmin" etc. If the system writes the characters in sequence, you might end up with "admin". We can just run this code repeatedly until we get the right result. This is a privilege escalation attack that lets us access information and capabilities we shouldn't have access to, such as file systems, etc. The security implications are severe.
For me personally, the biggest problem is the undefined behavior which can trigger elusive bugs.
Note that I used Java as the language of this tutorial but it should work similarly for other programming languages.
Serialize Everything?
Unfortunately, race conditions are remarkably hard to solve. Exclusive access or critical sections slow down application performance considerably. They block usage of computer resources and demolish our CPU cache utilization.
We want to minimize synchronization operations as much as possible, but we don't want undefined behavior.
There are many optimizations and strategies for building performant multi-threaded applications. A great example of that is maximizing read-only state, immutability, etc.
But the real problem is knowing that you have a race condition. How do you detect it?
Detecting a Race Condition
There are some great race detection tools in the market. Some work with static analysis where they review the application code and show the risky areas. Others work during runtime and inspect the activity of the threads. They aren't as common since the debug environment isn't as representative of the "real world".
Our production environments are remarkably complex and getting more complex every day. Detecting a race in that environment and verifying it is challenging...
Solving the Gap With Static Analysers
The problem with static analyzers is often they often issue false-positive results. They point at a risk, not something that might occur in reality. As a result, developers often discount their output. What if you could verify a potential race?
This is pretty easy to do with Lightrun. We can log the thread that is in the suspect block. If multiple threads enter the area at the same time, then there's a race condition.
The easiest thing we can do is add a log entry such as this:
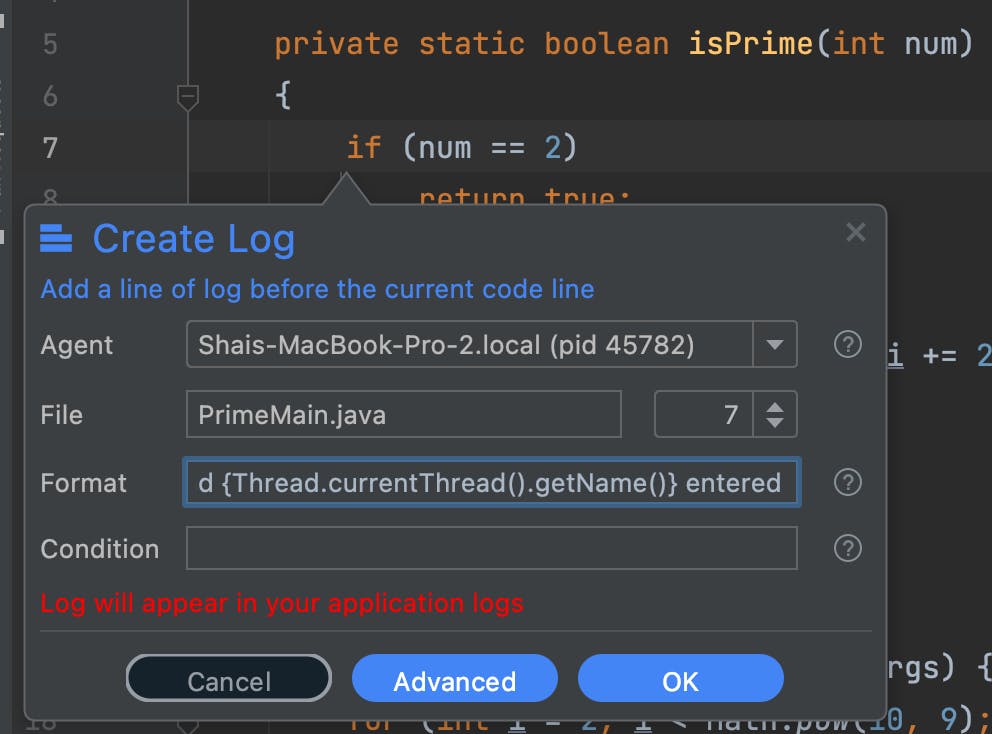
The log prints "Thread {Thread.currentThread().getName()} entered", we can add the corresponding "exited" version at the end of the piece of code. But this brings us to a fresh problem.
For simple cases, this will work well, but if we have many requests going through that code, we might run into throttling. Lightrun throttles actions when they take up too much CPU and, as a result, we might have uneven enter/exit printouts.
The solution is a multi-part solution. First, we can use logs as we did above to get the names of the threads that access this block.
Next, we need to verify that there's a large volume of requests. For that, we can add a counter:
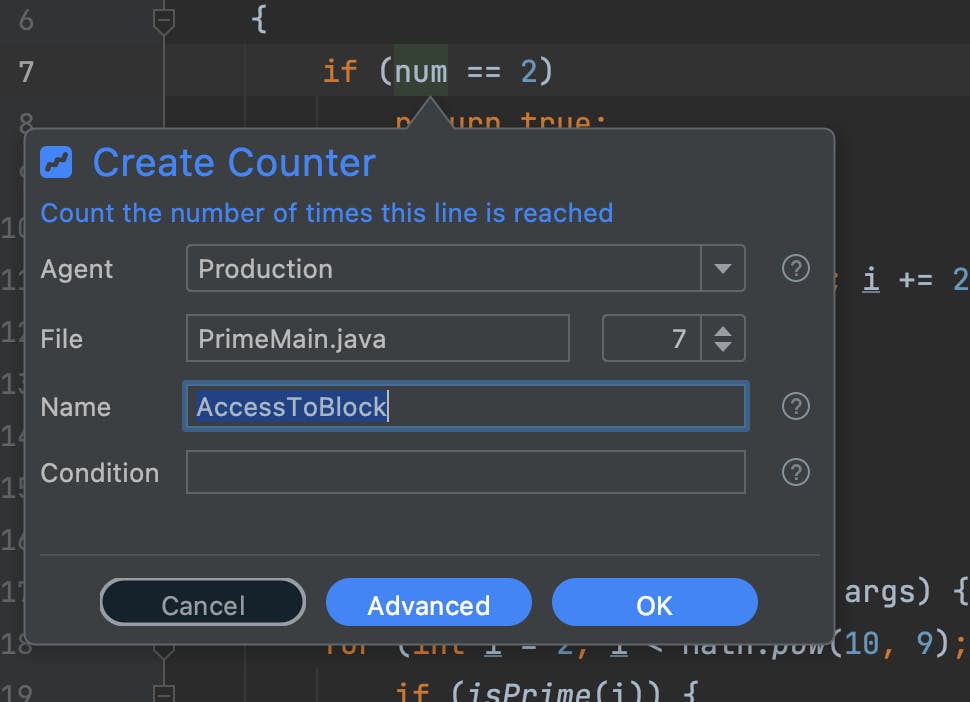
We can also narrow this further by limiting the counting to a specific thread e.g. for "Thread 1" we can set the condition to:
Thread.currentThread().getName().equals("Thread 1")
Finally, we can use a snapshot with multiple captures:
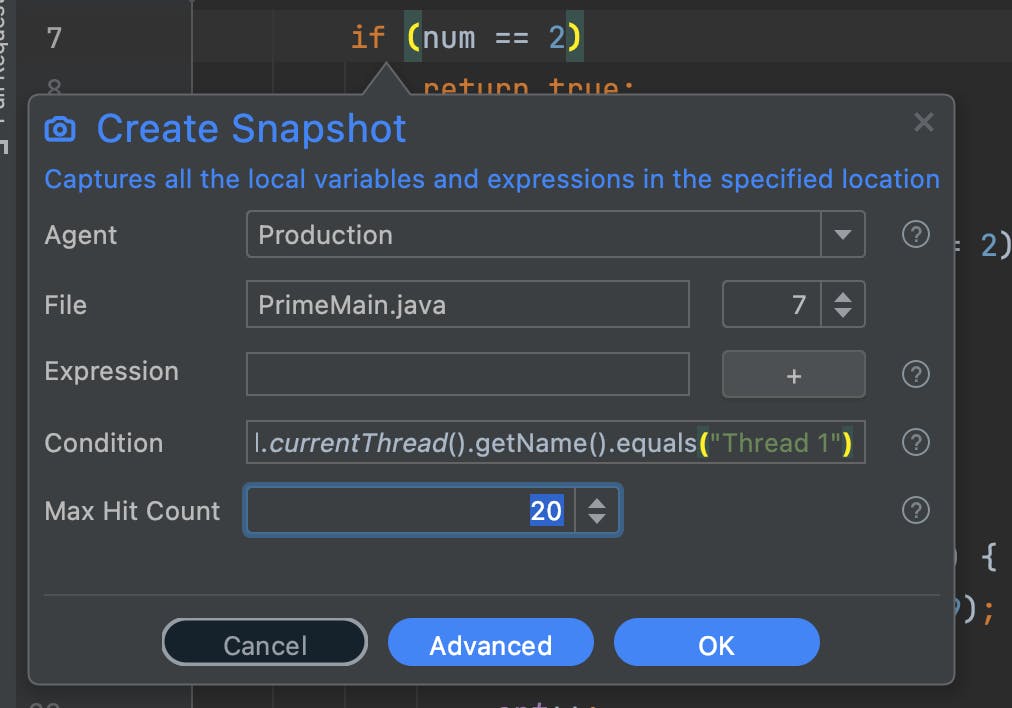
Notice the "Max Hit Count" below. It will trigger 20 separate hits. We can then review them and see the corresponding stack traces. If the path doesn't include synchronization or includes a bad monitor, there could be a problem here.
The Race we don't Know...
Concurrency is hard enough when we know what we're looking for. Tracking a race when we don't already have a clue about the direction is challenging.
Thankfully, we have encapsulation to the rescue. The worst races are those related to mutations of a memory location. All we need to do is place a log on the code that performs object mutation so it will print out the name of the current thread. With that, we can track the vast majority of potential races.
But we can do even better than that!
Here we add a multi-hit snapshot when the setter method is invoked with a different thread.
The condition is:
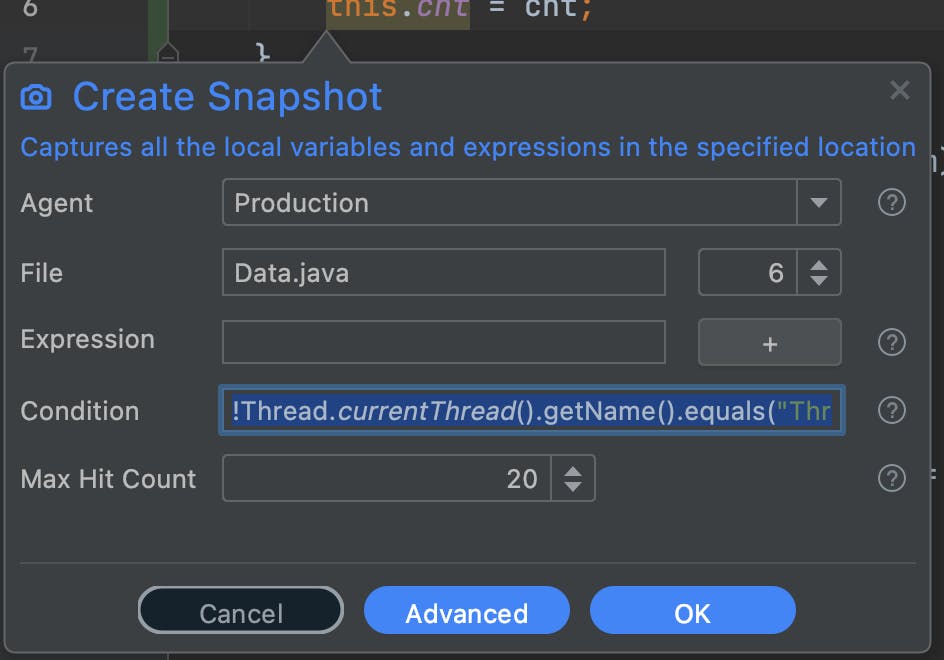
!Thread.currentThread().getName().equals("Thread 1")
Notice the "NOT" operator in the beginning. The assumption is that only "Thread 1" makes mutations, so you will literally see the stack trace to the code that accesses this operation from a different thread. You can leave an action like that in a long running system for days (don't forget to update expiry in the advanced mode) and the process will trigger this if there's access to that block.
TL;DR
We deploy modern programs on a scale like never before. Even a simple function on Lambda can change the dynamics of a complex deployment and trigger a synchronization problem that we can't see when debugging locally because of differences in connection times, environment, etc.
Race conditions can also be an attack vector which can lead to security issues. E.g. a memory location can be corrupted, privileges can be elevated, etc.
Debugging these problems in a local process is hard enough tracking this one production is a Herculean task. Simultaneous requests in the environment can interfere with our tracking, worse... We can trigger production problems if we aren't careful. Thankfully, Lightrun eliminates these problems!
Since Lightrun is asynchronous and long running by default, it's ideal for monitoring programs in production and reviewing access to various resources such as memory.